Calculations for AAS
The reported amount of of iron in WT E. coli is around 10^5 to 10^6 atoms per cell (Williams and Chatterji 2023).
Converting atoms per cell to micrograms per gram of cells
Using
\[ 10^5 \,\text{atoms Fe/cell} \]
the iron mass per cell is
\[ m_{\mathrm{Fe,cell}} = 10^5 \times \frac{55.845}{6.022\times10^{23}} \,\mathrm{g} \]
\[ m_{\mathrm{Fe,cell}} \approx 9.27\times10^{-18} \,\mathrm{g} \]
If the wet mass of an E. coli cell is
\[ m_{\mathrm{cell}} \approx 0.95 \,\mathrm{pg} = 0.95\times10^{-12} \,\mathrm{g} \]
then the iron content per gram of wet cells is
\[ \frac{9.27\times10^{-18}}{0.95\times10^{-12}} = 9.76\times10^{-6} \,\mathrm{g/g} \]
which is
\[ 9.76\times10^{-6} \,\mathrm{g/g} \times 10^6 \,\mu\mathrm{g}/\mathrm{g} = 9.8 \,\mu\mathrm{g}/\mathrm{g} \]
So,
\[ \boxed{10^5 \,\text{atoms Fe/cell} \approx 9.8 \,\mu\mathrm{g\ of\ Fe}/\mathrm{g \ wet \ cells}} \]
Maximum final volume allowed for all harvested E. coli cells
Detection threshold:
\[ 5 \,\mu\mathrm{g\ Fe}/\mathrm{mL} \]
I’m using the low-end estimate for wet E. coli iron content,
\[ c_{\mathrm{Fe}} \approx 10 \,\mu\mathrm{g\ Fe}/\mathrm{g\ of\ cells} \]
I harvested
\[ m_{\mathrm{cells}} = 3 \,\mathrm{g} \]
So the minimum expected total Fe in my full sample is
\[ m_{\mathrm{Fe}} = 3 \times 10 = 30 \,\mu\mathrm{g} \]
If the final volume is (V) mL, then the Fe concentration will be
\[ C_{\mathrm{Fe}} = \frac{30}{V} \,\mu\mathrm{g}/\mathrm{mL} \]
To stay above the detection threshold,
\[ \frac{30}{V} \geq 5 \]
Therefore, using the low-end estimate, the largest final volume I can dilute my full 3 g cell sample into while still staying above the detection limit is:
\[ \boxed{6 \,\mathrm{mL}} \]
Minimum detection threshold for the AASpectrometer is 5ppm = 5 mg/L. Yielded 3 grams in most recent trial with tonB, the strain with the least amount of iron content (supposedly). Need to know how much iron is in each cell (probably better to underestimate since its ton B), in order to determine how much cell is needed to reach the 5 mg/L threshold. From there, need to determine how much volume to put the cells in to keep it above threshold.
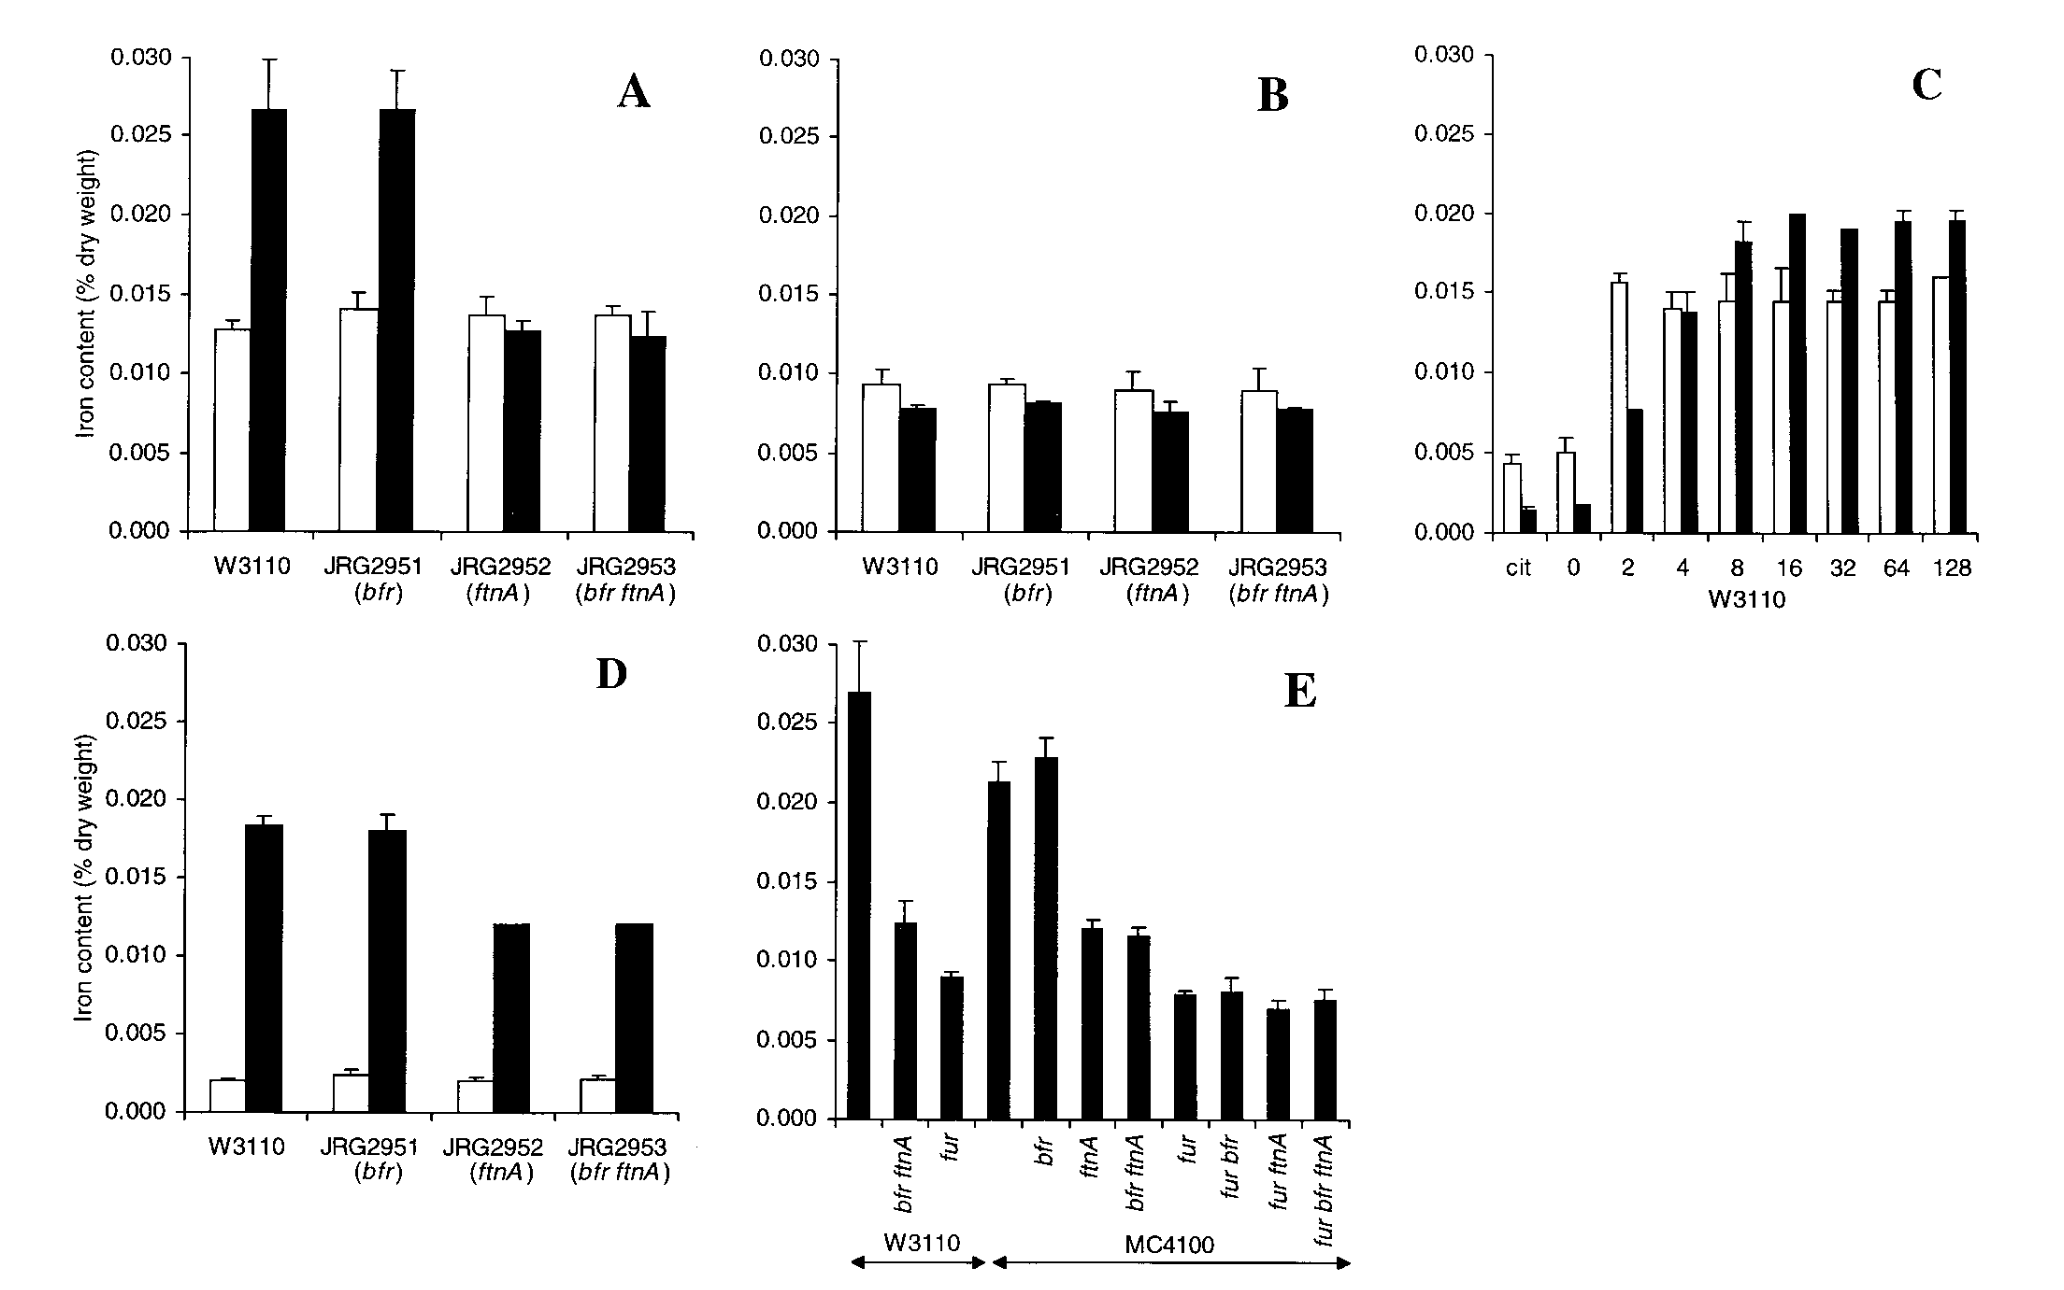
Side note: I recently reread an article from a previous post that showed ~2 fold increase in iron content from log to stationary phase. This is shown in the figure below, panel A. WT is W3110. White bar is the log phase and the black bar is the stationary phase. The increase in iron content is substantial, around 2 fold, but no significance is reported. I’m currently harvesting the cells at stationary phase, 2x, but I cannot assume this trend applies across all the tested strains. Just something to keep in mind.